1. Introduction
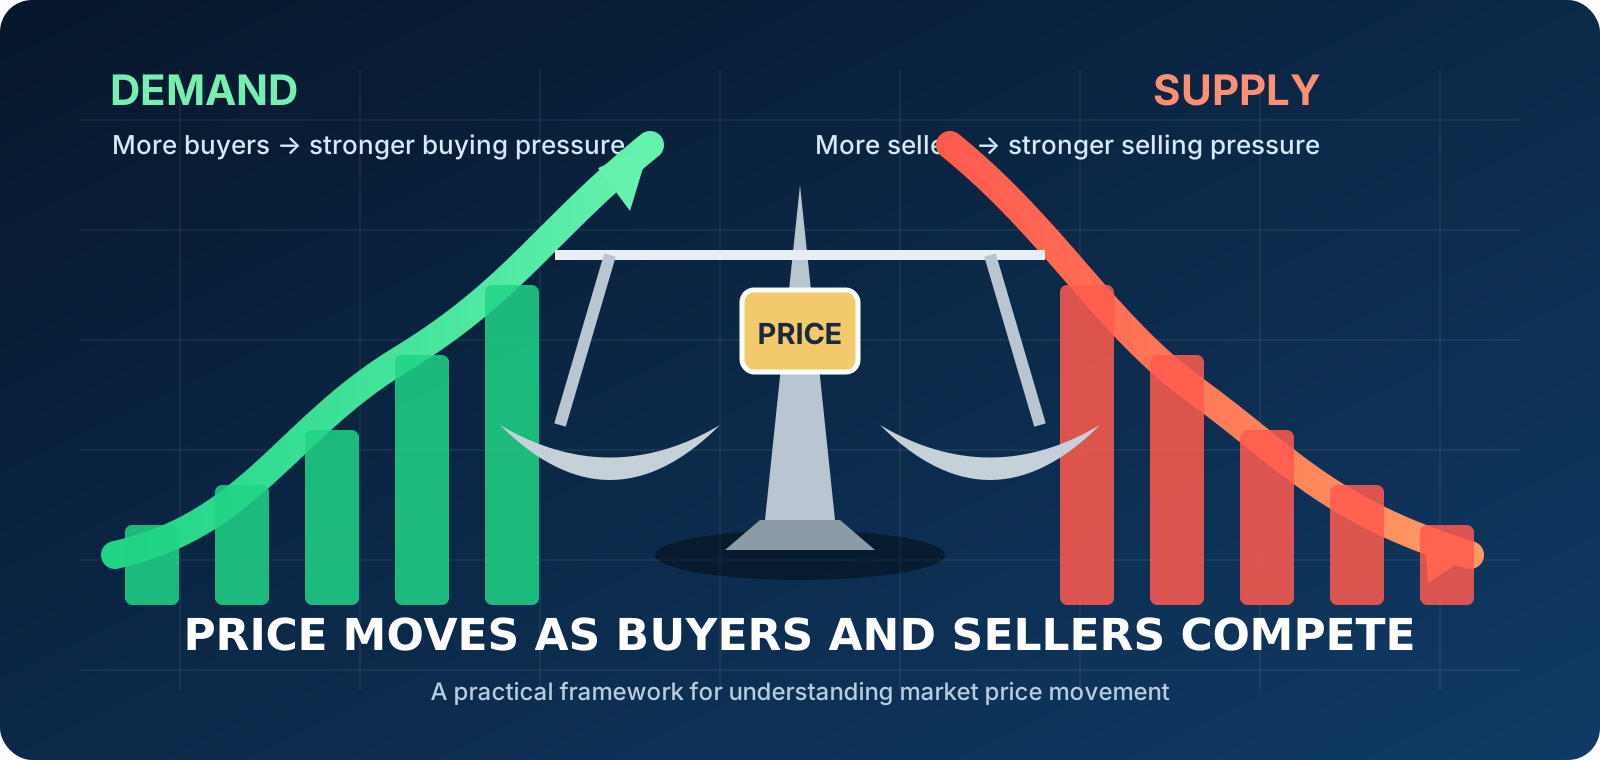
Think about a popular product that suddenly becomes difficult to find. If many people want it but only a few units are available, buyers usually become willing to pay more. If the same product is available in abundance and fewer people want it, sellers may have to accept a lower price. The stock market follows the same basic economic idea, although financial markets are faster, more emotional and influenced by a much wider set of information.
For a stock, demand represents buying interest while supply represents selling pressure. Every transaction is a meeting between a buyer and a seller, but the price keeps changing because the willingness of buyers and sellers changes from moment to moment.
The simple idea
When buying pressure becomes stronger than the available selling pressure, price can move higher. When selling pressure becomes stronger than the available buying interest, price can move lower. The important word is can: demand and supply are a framework for understanding price behaviour, not a guaranteed prediction.
2. What Is Demand in the Stock Market?
Demand is the desire and willingness of market participants to buy a stock at different prices. In practical market analysis, demand becomes visible when buyers repeatedly step in and absorb available selling pressure, particularly around an area where the stock previously attracted strong buying interest.
Demand can increase for many reasons. A company may report better-than-expected results, a sector may come into favour, institutional investors may increase exposure, or the broader market may shift into a risk-on mood. Sometimes the reason is obvious; sometimes the reason becomes clear only after the price has already moved.
What increasing demand may look like
- Price begins making higher highs and higher lows.
- Pullbacks find buyers sooner than before.
- Breakouts are supported by stronger-than-usual participation.
- Large selling candles are absorbed and followed by recovery.
- Price spends less time below an area where buyers have previously defended the stock.
Example
Suppose a hypothetical stock trades around ₹500 and repeatedly attracts buyers between ₹490 and ₹500. If a later decline reaches the same area and buying returns with improving volume, that region may be treated as a potential demand zone. It still needs confirmation; the zone can fail.
3. What Is Supply in the Stock Market?
Supply is the willingness of market participants to sell. When sellers are more aggressive around a particular price area, upward movement can become difficult. Traders often describe such an area as a supply zone, especially when price previously moved down sharply after spending time near that region.
Supply can increase because investors are taking profits, a valuation looks stretched, new information changes expectations, a sector loses momentum, or market participants simply decide that the current price is attractive enough to sell. There does not have to be one single reason.
What increasing supply may look like
- Price repeatedly struggles near the same area.
- Upper wicks show rejection after attempts to move higher.
- Breakouts quickly fall back into the previous range.
- Downward candles appear with expanding participation.
- Rallies become shorter and selling appears earlier than before.
4. How Demand and Supply Interact
At any moment, the market is continuously searching for a price at which buyers and sellers are willing to transact. This is often described as equilibrium. Equilibrium does not mean that the price will remain fixed. It simply describes a temporary balance between opposing forces.
Buying pressure strengthens
Price finds temporary agreement
Selling pressure strengthens
A useful way to think about price is not “demand means buy” or “supply means sell.” Instead, ask which side is becoming more aggressive, where that behaviour is occurring, and whether price action confirms the interpretation.
5. Demand Zones and Supply Zones
A demand or supply zone is better treated as an area than as one perfect price line. Markets rarely react to a single number with mathematical precision. Orders can be distributed across a range, and different participants can have different entry and exit levels.
How a demand zone develops
A common pattern is a period of consolidation or a pause followed by a strong move higher. If price later returns to that area and buyers respond again, analysts may mark it as a potential demand zone. The quality of the zone depends on context, the strength of the original move, the number of retests and what happens when price returns.
How a supply zone develops
A supply zone can form when price pauses before a strong decline. If a future rally returns to that area and sellers become active again, the region may be treated as potential supply. Again, it is a probability area, not a guaranteed reversal point.
6. Why Volume Matters
Price tells you what happened. Volume can add context about participation. A move through a demand or supply area with noticeably stronger volume may deserve more attention than a move that occurs on very light participation.
| Price Behaviour | Volume Behaviour | What It May Suggest |
|---|---|---|
| Breaks above supply | Strong increase | Breakout has stronger participation and deserves confirmation monitoring. |
| Breaks above supply | Very weak | Breakout may lack participation and can be more vulnerable to failure. |
| Falls into demand | Heavy selling, then absorption | Potential change in short-term pressure; price reaction still matters. |
| Falls through demand | Expanding volume | Breakdown may be meaningful, especially if price remains below the zone. |
Volume should not be interpreted in isolation. A high-volume candle can represent aggressive buying, aggressive selling, or both sides becoming highly active. The price response after the activity is often more informative.
7. Reading Demand and Supply With Price Action
Price action helps answer the question: what did buyers and sellers actually do after reaching the area? Candlestick structure, swing highs and lows, rejection wicks, engulfing patterns and break-and-retest behaviour can provide useful context.
Mark the area
Identify where a strong move started or where repeated reactions occurred. Avoid forcing a zone where the chart gives no clear evidence.
Wait for price to return
A zone becomes more useful when price revisits it. Observe how quickly price reacts and whether the reaction is supported by market structure.
Look for confirmation
Use a combination of candle behaviour, volume, trend and nearby support or resistance rather than relying on the zone alone.
Define invalidation
Before taking any trade decision, decide what price behaviour would prove your original idea wrong. This keeps risk management separate from hope.
8. Real-World Style Examples
Example A: Demand supports a pullback
Imagine a hypothetical stock rising from ₹420 to ₹510 and then correcting toward ₹475. Suppose ₹470–₹480 was the area from which the strongest previous rally began. If the stock reaches that range, selling slows, buyers appear and the price forms a higher low, the zone has provided useful context. A trader could then watch for confirmation instead of automatically buying at ₹475.
Example B: Supply caps a rally
Now imagine a stock moving from ₹700 to ₹820 before falling sharply. Months later, the stock rallies back toward ₹805–₹820. If sellers repeatedly reject that area and the stock fails to hold above it, the previous supply region becomes relevant. A sustained breakout with participation would change the interpretation.
Example C: Zone failure
A demand zone can fail. If price enters the zone, selling continues, volume expands and the stock closes decisively below the area, continuing to treat the zone as strong support can become a costly mistake. The market has supplied new information, and the analysis should adapt.
9. Factors That Change Demand and Supply
Demand and supply are not created by chart patterns alone. They reflect expectations. Some of the forces that can shift those expectations include:
- Earnings and guidance: changing expectations about future profits can alter buying and selling interest.
- Interest rates and liquidity: changes in the cost and availability of money can affect how investors value risk assets.
- Sector trends: strong or weak industry-wide momentum can influence many stocks simultaneously.
- News and events: regulatory decisions, major contracts, management changes or unexpected developments can rapidly change sentiment.
- Valuation: investors may become more willing to sell as prices move far beyond what they consider reasonable, or more willing to buy after a substantial decline.
- Market structure: trends, previous highs and lows, and major support/resistance areas influence where participants may become active.
10. Practical Application for Investors and Traders
The biggest benefit of demand-and-supply analysis is that it gives you a way to organise your observations. Instead of asking only “Will this stock go up?”, you can ask better questions:
- Where did strong buying or selling previously occur?
- Is the current trend supporting or contradicting the zone?
- What is price doing as it approaches the area?
- Is volume confirming the move?
- Where would the idea become invalid?
- Is the potential reward reasonable compared with the risk?
Avoid the common shortcut
Do not turn every previous low into a demand zone or every previous high into a supply zone. A useful zone needs context. The stronger the evidence and the clearer the reaction, the more meaningful the area may be.
11. Common Mistakes
| Mistake | Why It Can Be a Problem | Better Approach |
|---|---|---|
| Treating zones as exact lines | Markets can overshoot an area before reversing. | Use a zone and define invalidation separately. |
| Ignoring the broader trend | A counter-trend reaction can be short-lived. | Read the zone in the context of market structure. |
| Using volume alone | High volume does not automatically reveal direction. | Compare volume with the price response. |
| Entering without a risk plan | A correct idea can still produce an uncomfortable loss. | Decide position size and invalidation before entry. |
| Redrawing zones after every candle | Constantly changing the analysis can create hindsight bias. | Use objective rules and review the setup consistently. |
12. Key Takeaways
- Demand represents buying interest; supply represents selling pressure.
- Price changes because the balance between those forces changes.
- Demand and supply zones are better viewed as areas of interest, not perfect lines.
- Price action and volume can help confirm whether a zone is actually attracting participants.
- A zone can fail, so invalidation and risk management are essential.
- The concept works best as part of a broader process that includes trend, market structure, valuation or fundamentals where appropriate, and disciplined risk management.
13. Frequently Asked Questions
What is demand in the stock market?
Demand is the willingness and ability of market participants to buy shares at different prices. In chart analysis, strong demand may appear as repeated buying or a strong upward response from a price area.
What is a supply zone?
A supply zone is an area where selling pressure has previously been strong or where sellers may become active again. It is an area of interest, not a guaranteed reversal level.
Is demand and supply analysis enough to trade?
No single method is enough for every market condition. Demand and supply can be combined with trend, price action, volume, support and resistance, fundamental context and risk management.
Can a demand zone fail?
Yes. If price moves decisively through the area and selling remains strong, the original demand interpretation may no longer be valid. Good analysis includes a clear invalidation point.
What is the difference between demand/supply zones and support/resistance?
They overlap in practice, but the emphasis is different. Support and resistance often describe areas where price has reacted historically, while demand and supply analysis places more emphasis on the imbalance and origin of strong buying or selling pressure.
Have a Question or Your Own View?
Ask a question, share your thoughts, or help another reader understand the topic.