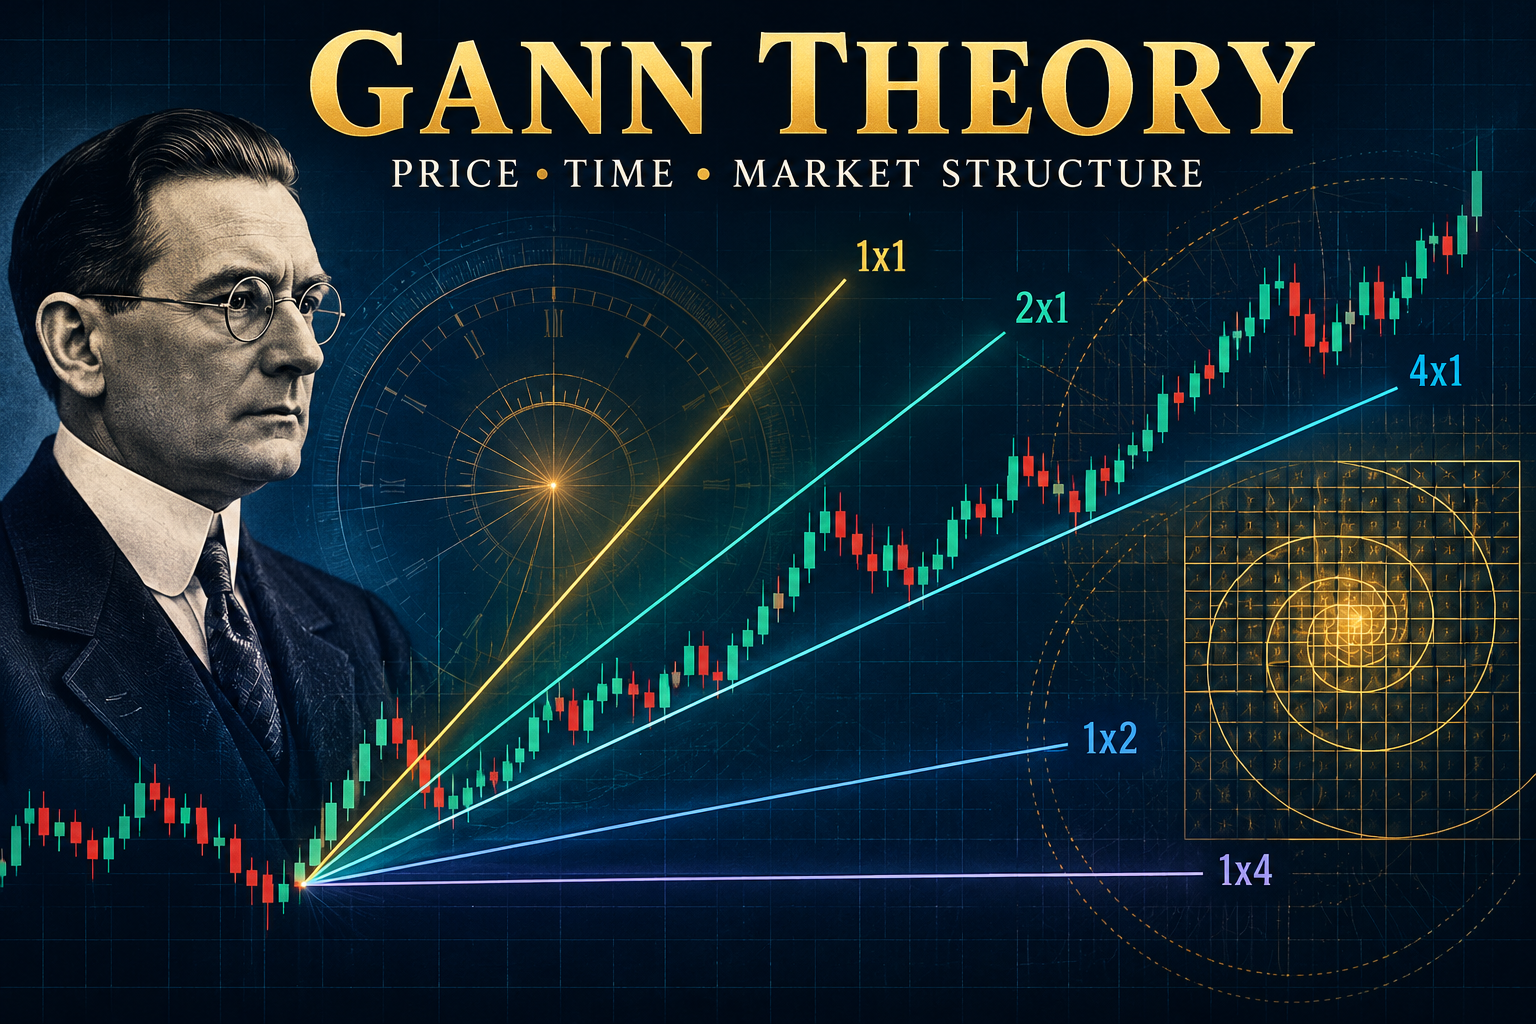
1. What Is Gann Theory?
Gann Theory is a method of technical analysis that studies the relationship between price movement and time. It is associated with William Delbert Gann (W.D. Gann), an early twentieth-century market analyst and author. The broad idea is that markets do not move only from one price to another; the amount of time taken to make a move, the speed of that move and the points where price and time appear to balance may also matter.
Most modern traders encounter Gann through three practical groups of tools: Gann angles and the Gann Fan (to study trend strength and dynamic support or resistance), price-time or cycle analysis (to watch for periods when a trend may pause or change), and the Square of 9 (a geometric number tool used by practitioners to project possible price levels).
Think of it this way: ordinary horizontal support and resistance ask, “At what price might buyers or sellers become active?” Gann analysis adds another question: “At what rate is price travelling, and how much time has the move consumed?”
Important reality check
Gann Theory is a framework, not a law of the market. Its tools involve choices about swing points, time units, chart scaling and calculation conventions. Different choices can produce different lines and levels. Treat every Gann level as a hypothesis to test—not as a prediction that must come true.
2. Who Was W.D. Gann?
William Delbert Gann (1878–1955) was an American trader and market writer whose work influenced generations of technical analysts. His published work includes Truth of the Stock Tape and 45 Years in Wall Street. He studied price records across different time horizons and developed a style of analysis that connected market swings, proportions, geometry and timing.
Gann’s reputation has also attracted extraordinary stories about the accuracy of his forecasts. Those stories should be separated from independently verified evidence. A historical claim that a trader made a remarkable forecast is not the same as a complete, independently audited record showing repeatable results after costs and risk. The useful approach for a modern trader is to study the methods that can be defined clearly and tested with data.
3. The Core Ideas Behind Gann Theory
3.1 Price and time are studied together
Price tells you how far a market has moved. Time tells you how long it took. A 10% rise in ten sessions is a different pace from a 10% rise in one hundred sessions. Gann analysis attempts to interpret that relationship rather than looking at price alone.
3.2 Trend has a measurable pace
A trend can be fast, slow or weakening. Gann angles represent different rates of price movement over time. If price stays above a rising reference angle, a practitioner may interpret the trend as maintaining its pace. If it breaks below, the trend may be losing momentum. This is a chart-reading convention, not proof that the trend has reversed.
3.3 Markets move in swings and cycles
Markets alternate between advances, declines and consolidations. Gann-style cycle work looks for recurring time intervals between important highs and lows. A cycle date should be treated as a window to pay closer attention—not a date on which a reversal is guaranteed.
3.4 Levels gain importance when evidence clusters
A projected angle, a previous swing high, a horizontal support zone and a widely watched moving average lining up near the same area can create a more interesting decision zone. The confluence is useful for planning, but it does not eliminate the possibility of a breakout or a false signal.
4. Gann Angles Explained: 1x1, 2x1, 1x2 and More
A Gann angle is a line drawn from a meaningful price pivot across time. The notation describes the intended relationship between price units and time units. A 1x1 angle is commonly described as one unit of price for one unit of time. A 2x1 angle represents two price units for one time unit; a 1x2 represents one price unit for two time units.
| Angle | Conceptual rate | Common interpretation in an uptrend |
|---|---|---|
| 8x1 | 8 price units per 1 time unit | Very steep advance; often difficult to sustain |
| 4x1 | 4 price units per 1 time unit | Very strong momentum |
| 3x1 | 3 price units per 1 time unit | Strong upward pace |
| 2x1 | 2 price units per 1 time unit | Faster-than-1x1 pace |
| 1x1 | 1 price unit per 1 time unit | Traditional balance line; often treated as a key trend guide |
| 1x2 | 1 price unit per 2 time units | Slower upward pace |
| 1x3 / 1x4 / 1x8 | Progressively slower rates | Shallower trend guides |
Do not confuse the ratio with the visual slope on your screen. The angle only has a consistent geometric meaning when the chart’s price and time scales are calibrated appropriately. Zooming, changing the chart size, changing the timeframe or using a different price scale can make the same line look steeper or flatter. A 45-degree line drawn casually on a screen is not automatically a valid 1x1 Gann angle.
How traders interpret a 1x1 line
- Price holding above a rising 1x1 line may indicate that the advance is maintaining its chosen pace.
- Price falling below the line may signal a loss of pace and a need to reassess the trend.
- After a decisive break, the same line may be watched as possible resistance on a rebound.
- Repeated reactions around a line may make it a useful reference, but the number of touches alone does not prove predictive power.
Practical point
Always define the price unit, time unit, anchor point and chart scale before drawing an angle. Without those settings, two traders can draw different “1x1” lines on the same stock and both believe they are following the same rule.
5. What Is a Gann Fan?
A Gann Fan is a group of Gann angles radiating from one important swing low or swing high. On an uptrend chart, the fan is usually drawn from a significant low. On a downtrend chart, it is commonly drawn from a significant high. The lines create a map of different possible trend speeds.
How to read a bullish Gann Fan
- Identify a clear, confirmed swing low—not a random one-candle dip.
- Choose a consistent chart timeframe and calibrated price/time scale.
- Draw the fan from that low using the platform’s documented angle settings.
- Observe whether price respects a rising angle, accelerates through one, or loses support.
- Wait for price action to confirm the interpretation before planning a trade.
How to read a bearish Gann Fan
Start from a confirmed swing high and draw the fan downwards. A falling market that remains below a relevant descending angle may be maintaining its bearish pace. A move above the angle can warn that the decline is slowing, but it does not by itself confirm a new bull trend.
Do not redraw the fan every time price moves against your view. That turns the analysis into hindsight. Decide in advance what qualifies as a new major pivot and record the original fan so that the result can be evaluated honestly.
6. Square of 9: What It Is and How Traders Use It
The Square of 9 is a number spiral in which numbers are arranged around a central starting value in a geometric pattern. Gann practitioners use angular relationships on the spiral to derive possible price levels. The method is often called a price calculator, but there is no single universally accepted convention for every market, instrument or software implementation.
The commonly used square-root relationship
One popular family of Square of 9 calculations starts with the square root of a reference price, adds or subtracts a rotation amount, and then squares the result. In a simplified form:
Illustrative formula:
Projected level = (√P ± R)²
Here, P is the chosen reference price and R is a rotation adjustment. The adjustment may be expressed differently by different practitioners—for example, as a fraction of a full rotation. This is a simplified explanation, not a universal official formula.
Simple numerical illustration
Assume a stock has a reference price of ₹100. Its square root is 10. If a practitioner chooses an illustrative adjustment of 0.25, the upward calculation becomes (10 + 0.25)² = 105.0625 and the downward calculation becomes (10 − 0.25)² = 95.0625. These are mathematically derived reference levels—not guaranteed resistance or support.
Some calculators use different increments, degrees, rounding rules, instrument adjustments or starting prices. Before relying on a Square of 9 output, confirm exactly which convention the tool uses. Do not mix levels from different calculators as if they were identical.
How to use Square of 9 levels responsibly
- Choose a meaningful and documented reference price, such as a major swing high or low.
- Record the calculation convention and rotation step.
- Compare projected levels with actual historical price reactions.
- Look for confluence with horizontal support/resistance, volume, market structure or other independently defined signals.
- Use the level as an alert or planning zone, not as a blind entry order.
7. Gann Time Cycles and Time Counts
Time-cycle analysis studies the number of trading sessions, weeks or months between important turning points. Gann-related material often discusses intervals such as 30, 45, 60, 90, 120, 144, 180, 270 and 360 units. Traders may also examine anniversaries of major highs and lows.
There is no reliable universal rule that says a market must reverse on any one of these counts. The chosen pivot, whether calendar days or trading sessions are counted, holidays, timeframe and tolerance window all affect the result. A more disciplined approach is to treat a cycle date as a watch window and then demand price confirmation.
A practical cycle-study process
- Mark several major swing highs and lows on the same timeframe.
- Measure the distance between them using one consistent counting method.
- Check whether similar intervals recur more often than would be expected by chance.
- Define a tolerance window before reviewing the next period.
- At the projected window, look for an actual change in price structure, momentum or volume.
- Record missed cycle windows as carefully as successful ones.
8. What Does “Squaring Price and Time” Mean?
In Gann language, “squaring” price and time refers broadly to a point where a chosen price movement and a chosen time movement reach a relationship considered significant by the method being used. Traders may compare the size of a price swing with the number of sessions it took, or use geometric tools to identify a potential balance point.
It is important not to assume that price and time are naturally measured in identical units. A rupee is not the same thing as a trading day. Any comparison requires a defined scale or conversion convention. If the scale is changed, the apparent balance can change too. This is one reason Gann analysis can be subjective when the rules are not specified in advance.
9. Step-by-Step: How to Apply Gann Theory to an Indian Stock Chart
Use the following workflow on a liquid NSE stock or index. The example is educational; it is not a live recommendation or a prediction for a particular security.
- Select the instrument and timeframe. Start with a liquid stock or index. Use weekly charts for major trend context and daily charts for swing-trading decisions. Avoid switching timeframes midway through the analysis.
- Mark the major swing. Identify a visible, confirmed low for a bullish study or high for a bearish study. Write down the date and price.
- Set the chart scale. Confirm the platform’s Gann angle calibration. Record whether the chart is arithmetic or logarithmic and how price/time units are defined.
- Draw the Gann Fan. Add the 1x1 and surrounding angles from the chosen pivot. Do not select whichever line happens to fit the past move best after seeing the outcome.
- Map horizontal levels. Mark previous swing highs/lows and consolidation zones. These provide a separate reference against which to assess the angle.
- Check time windows. Measure intervals between major pivots. Define the cycle window and tolerance before the next window arrives.
- Wait for confirmation. Look for a breakout, rejection, close beyond a level, volume expansion or a change in market structure. The confirmation rule should be written down in advance.
- Plan the risk. Decide the invalidation point, stop-loss, position size and maximum rupee risk before entry.
- Record the trade. Save a chart screenshot and note the setup, entry, stop, exit, slippage and costs. Include trades where the signal failed.
10. Worked Example: A Hypothetical Bullish Setup
Suppose a stock makes a confirmed weekly swing low at ₹500. Over the following weeks, price rises and a calibrated 1x1 angle is drawn from that low. Later, the stock pulls back toward the angle while a previous breakout zone is also nearby.
| Observation | What it may suggest | What it does not prove |
|---|---|---|
| Price remains above a rising 1x1 | The selected trend pace is intact | That price cannot fall below it tomorrow |
| Pullback approaches 1x1 and prior breakout zone | A potential decision area with confluence | That the area must hold as support |
| Bullish candle forms and price closes back above the zone | Possible evidence that buyers are responding | That a profitable trade is assured |
| Price closes decisively below the swing structure | The bullish thesis may be invalidated | That the market must immediately become bearish |
A disciplined trader would not buy simply because the price touches the line. The trader would define a confirmation trigger, place the stop where the setup is invalidated, calculate position size and accept that the trade may lose. The same logic applies in reverse for a bearish setup from a swing high.
11. Combining Gann with Other Technical Tools
Gann tools are usually more useful as part of a complete decision process than as a standalone signal. Keep the roles of the tools separate so that you do not count the same information twice.
- Market structure: Identify higher highs/higher lows in an uptrend or lower highs/lower lows in a downtrend. This is the basic context.
- Horizontal support and resistance: Use prior swing zones to see whether a Gann angle coincides with an area where price previously reacted.
- Volume: Observe whether a breakout or rejection is accompanied by meaningful participation. Volume is context, not confirmation by itself.
- Moving averages: A 20-, 30- or 50-period moving average can provide a separate trend reference. Specify the timeframe; a weekly 30-period average is not the same as a daily 30-period average.
- RSI or momentum: Momentum divergence may warn that a trend is weakening, but it can persist for a long time in a strong trend.
- ATR: Average True Range can help set volatility-aware stops and avoid placing stops at arbitrary distances.
Do not add indicators until the chart looks convincing. More lines create more opportunities to find a pattern after the fact. A small number of clearly defined rules is easier to test and execute.
12. Which Markets and Timeframes Can Be Studied?
Gann-style tools can be drawn on equities, indices, commodities, currencies and futures wherever reliable price and time data are available. That does not mean the same settings work equally well across all instruments.
- Weekly charts: Useful for major swings and broad trend context; fewer signals but wider stops.
- Daily charts: Often more practical for positional and swing traders.
- Intraday charts: More sensitive to chart scaling, session boundaries, gaps, liquidity and noise. Test carefully before using angles for short-term entries.
- Options: Option premiums are affected by volatility, time decay and changes in the underlying. A Gann level on the underlying does not directly determine an option premium.
For Indian markets, remember that NSE trading sessions, holidays, price bands, corporate actions and gaps affect chart data. Adjust historical prices for splits and bonuses where appropriate, and use consistent session data.
13. Common Mistakes Traders Make with Gann Theory
- Drawing angles without calibration: A visually attractive diagonal is not automatically a meaningful Gann angle.
- Choosing pivots with hindsight: Moving the anchor until the line fits the chart makes the method impossible to evaluate honestly.
- Treating cycle dates as certain turning points: Time windows are not expiry dates for a trend.
- Believing every Square of 9 level: Different conventions generate different outputs; levels need independent validation.
- Ignoring market regime: A method that appears to work in a trending market may fail in sideways or highly volatile conditions.
- Overfitting: Changing angles, counts and parameters until past trades look perfect does not create a robust strategy.
- Ignoring costs: Brokerage, taxes, exchange charges, spread and slippage can turn a theoretical edge into a losing strategy.
- Trading without a stop: No technical tool removes gap risk or guarantees that a support line will hold.
14. How to Backtest Gann Theory Properly
Backtesting is the difference between a chart pattern that looks convincing and a rule set that has evidence behind it. Before testing, convert each idea into objective rules that another person could follow without asking you what you meant.
Write down the rules first
- What exactly qualifies as a swing high or swing low?
- When is the pivot considered confirmed? A pivot that requires future candles cannot be used before those candles exist.
- What price/time calibration and angle settings are used?
- What constitutes a touch, break, close beyond a line or retest?
- What is the entry trigger, stop, exit, position sizing and maximum holding period?
- How are gaps, corporate actions, missing data and transaction costs handled?
Use out-of-sample testing
Develop the rules on one historical period, then freeze them and test on a later period that was not used to design the strategy. Consider different market regimes and a broad enough universe to avoid relying on one unusually successful stock. Avoid survivorship bias by including delisted or removed securities where the data permits.
Measure more than win rate
| Metric | Why it matters |
|---|---|
| Net expectancy per trade | Average expected result after costs, combining wins and losses |
| Profit factor | Gross profits divided by gross losses |
| Maximum drawdown | Largest peak-to-trough decline in the strategy equity curve |
| Average win / average loss | Shows whether reward compensates for risk |
| Trade count and sample size | Very small samples can produce misleading results |
| Performance by regime | Shows whether results depend on bull, bear or sideways markets |
A recent 2026 working paper reports an empirical test of selected Gann-angle predictions using one-minute E-mini S&P 500 futures data. Its abstract reports positive results for some narrowly specified tests and negative results for others. It is a working paper, not a universal validation of Gann Theory, and it does not establish that the same rules work on Indian equities or for every Gann tool. Read the method and limitations before drawing conclusions.
15. Advantages and Limitations of Gann Theory
| Potential advantages | Limitations |
|---|---|
| Encourages traders to consider both price and time | Angle calibration and anchor selection can be subjective |
| Provides a structured way to map trend pace | Different chart scales can change the visual geometry |
| Can help define areas for observation and planning | Projected levels do not guarantee price reactions |
| Can be converted into rules and backtested | Many popular interpretations are not precisely defined |
| Can complement market structure and risk management | Complexity can encourage overfitting and hindsight bias |
16. A 30-Day Learning Plan for Beginners
- Days 1–5: Learn swing highs, swing lows, trend structure, support and resistance. Mark them on weekly charts without drawing Gann lines.
- Days 6–10: Study Gann angle definitions and chart calibration. Draw fans on historical charts and record the settings.
- Days 11–15: Study Square of 9 conventions. Use one calculator or one written formula consistently; compare levels with historical price behaviour.
- Days 16–20: Measure time intervals between major pivots. Define cycle windows and record both hits and misses.
- Days 21–25: Build one simple setup with entry, invalidation, stop and exit rules. Do not add multiple indicators.
- Days 26–30: Review at least 30–50 historical examples if data allows, then paper trade. Do not risk capital until the rules are clear and tested.
17. Gann Trading Checklist Before Taking a Trade
- Have I identified a confirmed swing pivot?
- Have I fixed the timeframe and chart scale?
- Can I explain the angle or Square of 9 calculation I am using?
- Is the market structure aligned with my trade direction?
- Is there a separate price-action confirmation?
- Where exactly is the trade invalidated?
- Is the stop-loss realistic relative to volatility?
- Have I calculated quantity based on the rupee risk I can afford?
- Have I considered gaps, liquidity, slippage and charges?
- Will I record the trade even if it loses?
18. Final Takeaway: Should You Use Gann Theory?
Gann Theory offers an interesting way to study trend speed, price-time relationships and possible turning-point windows. The most accessible tools for a modern trader are Gann angles, the Gann Fan and a clearly specified Square of 9 calculation. Their value depends on disciplined definitions, consistent chart settings and evidence from testing.
Do not buy or sell a stock only because it touches a Gann angle, reaches a Square of 9 number or arrives at a cycle date. Use these ideas to frame a question, then let price action, risk management and tested rules decide whether a trade is justified. If a method cannot be defined clearly enough to backtest, it is not yet a trading system.
Remember this
Understand the tool. Define the rule. Test it on unseen data. Control the risk. Never confuse a geometric projection with certainty.
19. Sources & Further Reading
- Wiley – “Who Was W. D. Gann?”: historical overview of Gann’s work and place in technical analysis.
- Pearson sample chapter – The Trading Methodologies of W.D. Gann: discussion of Gann methods and historical claims.
- SSRN – Do Gann Angles Work? An Empirical Test of Angle-Derived Support and Resistance in High-Frequency Equity Futures (2026): a recent working paper testing selected angle-based rules.
- Oxford Academic – Economic Humanities and the History of Financial Advice: historical context for the development and reception of market forecasting ideas.
These references provide historical and methodological context. They should not be read as a guarantee that Gann methods produce profits.
20. Disclaimer
This article is for educational and informational purposes only. It is not investment advice, a buy/sell recommendation, a research report or a promise of returns. Technical-analysis methods, including Gann Theory, can generate false signals and may not work in all market conditions. Consult a SEBI-registered investment adviser where appropriate and make decisions based on your own financial situation and risk tolerance. Past performance does not guarantee future results.
21. Frequently Asked Questions About Gann Theory
What is Gann Theory in simple words?
It is a technical-analysis approach that studies how price movement relates to time. Traders use angles, cycles and geometric price calculations to identify possible trend guides and decision zones.
Who invented Gann Theory?
It is associated with W.D. Gann, an American trader and market writer who lived from 1878 to 1955.
What is a 1x1 Gann angle?
It represents one defined price unit for each defined time unit. Its usefulness depends on consistent price/time calibration; it is not simply any diagonal line that looks like 45 degrees on a chart.
What is the difference between a Gann Fan and Gann angles?
A Gann angle is one price-time line. A Gann Fan is a collection of several angles drawn from one selected pivot.
What is the Square of 9 used for?
It is a geometric number arrangement used by some traders to calculate possible price reference levels using angular or rotational relationships. Different conventions can produce different outputs.
Does Gann Theory predict exact market tops and bottoms?
No method can reliably guarantee exact turning points. Gann tools can identify areas or time windows to monitor, but price confirmation and risk controls remain essential.
Can beginners learn Gann Theory?
Yes, but beginners should first understand trend structure, support and resistance, candles and risk management. Start with one tool and one timeframe rather than attempting every Gann concept at once.
Can Gann Theory be used for Nifty and Bank Nifty?
It can be studied on index charts, but settings must be defined and tested for the instrument and timeframe. Do not assume a rule that appears to work on one stock will work on an index or options contract.
Is Gann Theory better than Fibonacci?
Neither is universally better. They use different frameworks and both require clear rules and testing. Compare them using the same data, costs and out-of-sample period.
Can I use Gann Theory alone for trading?
Relying on any single technical tool is risky. A trading plan should also define market context, entry confirmation, invalidation, position size and exit rules.